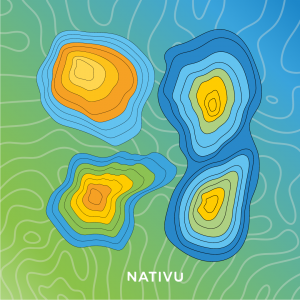
Contour lines are imaginary lines drawn on topographic maps that represent the elevation of the terrain above sea level. They connect locations of equal value in a raster dataset representing continuous phenomena such as elevation, temperature, precipitation, pollution, or atmospheric pressure. The line entities connect cells of constant value in the input.
Main Characteristics:

Utility of Contour Lines:
How to Read Contour Lines
Contour lines help identify different landforms, such as hills, valleys, slopes, and plateaus. Each line represents a constant elevation. For example, if a contour line is labeled as 100 meters, all points along that line are 100 meters above sea level.
The proximity of contour lines indicates the slope of the terrain. Very close contour lines indicate a steep slope, while more widely spaced lines indicate a gentle slope.
Reading and interpreting contour lines requires practice, as a two-dimensional map must convey three-dimensional information about the terrain. Surveyors, geologists, and other professionals use these maps to plan constructions, study geology, and perform other land-related tasks.


